Filters
Dashboard Designer provides users with the ability to select and visualize specific data based on their preferences or needs. These filters help personalize the user experience and facilitate data exploration.
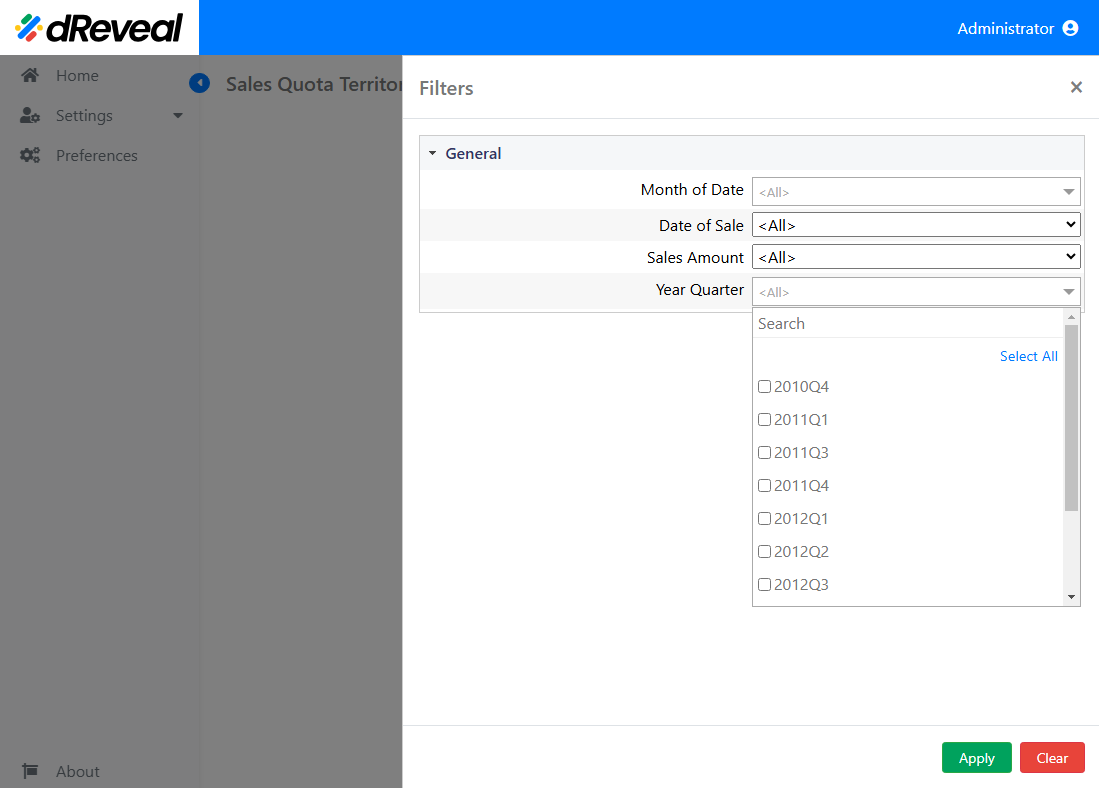
The dReveal filters are crucial components of our reporting generation tool, designed to give end users the ability to customize and refine their data queries. These filters serve as user-friendly interfaces, allowing individuals to select specific criteria or values relevant to their analysis.
dReveal filters serve as interactive prompts for end-users, allowing them to select specific values. These selected values are then utilized by our powerful engine to perform various filtering operations and create conditions within the application.

Show
It empowers users to customize their data view, allowing them to select and highlight specific information. This feature facilitates the identification of trends, patterns, and exceptions, streamlining the analysis and decision-making process.
Apply a Filters
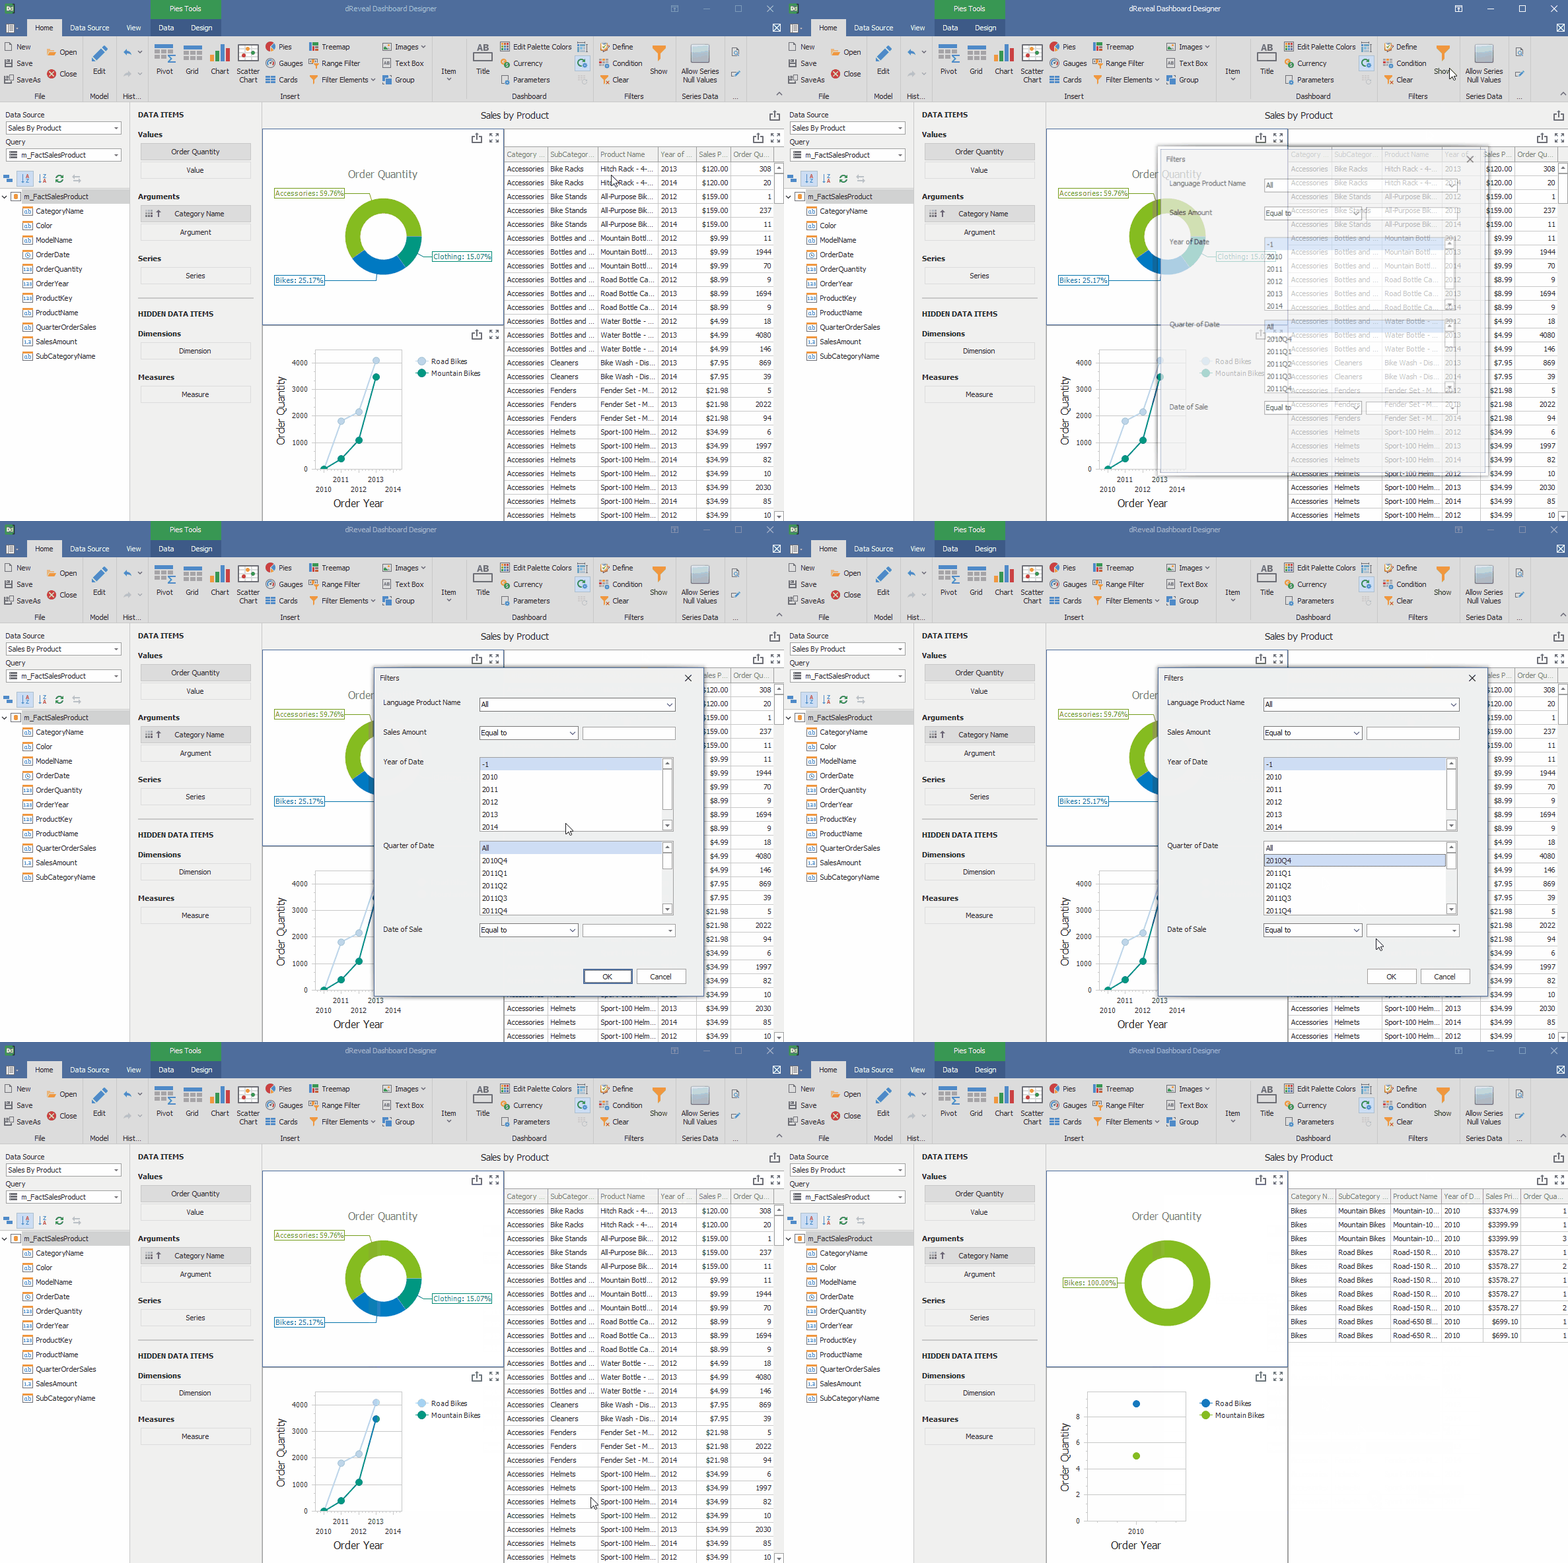
Customize your view with filters by accessing the Dashboard Designer, loading or creating your report, and activating the 'Show' option. Then, select the filter that best suits your needs and apply the changes.
Dashboard Designer

Expected Output

Clear
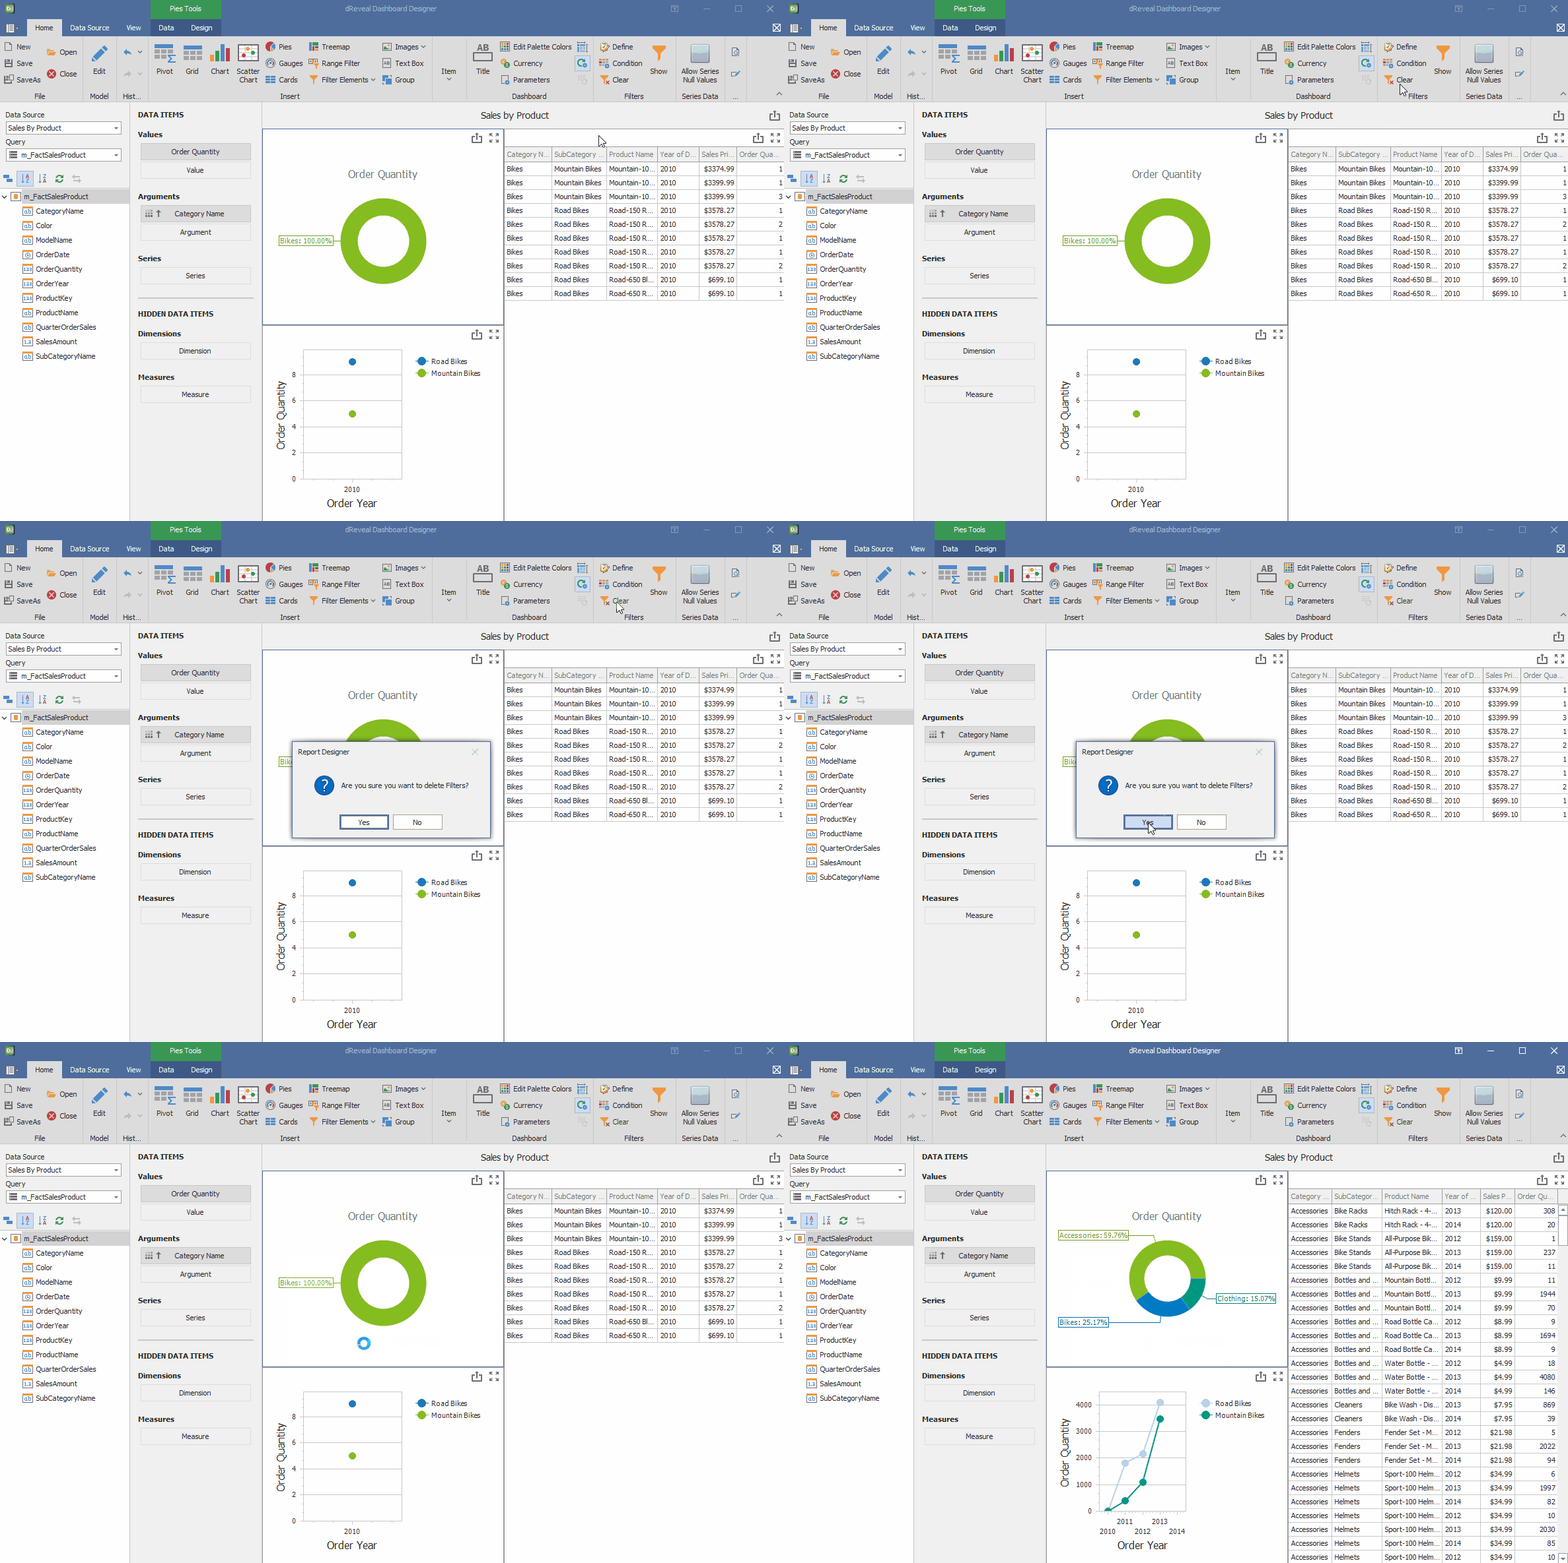
This option allows the user to clear the applied filters in the report to display all data in the report without any applied filters.
Clear the Applied Filter
To clear an applied filter, first apply some filters. Then, click on the "Clear" icon. Finally, click the "Yes" button to confirm the action.

